![]()
Beratung und Entwicklung - Mehr Produktivität für Microsoft Office
![]()
Consultant and Developer - Get more productivity from Microsoft Office
Kontakt
domke consulting
Falltorweg 6
D-63303 Dreieich
Telefon: +49 6103 596 69 47
Telefax: +49 6103 596 69 58
Mail: info@domke-consulting.com

Data representation
Excel Dashboard and Reporting Solution
Client and Project Scope
The client
The client is the holding company of a large international retailer with a booming online business. The subsidary firms specialize in different retail sectors (e.g. fashion, life style). Each subsidiary owns one or multiple webshops for their brands. Traffic is analyzed with Webtrends tools and consolidated in a MySQL database.
The project scope and the requirements
The e-commerce department needs a tool to present Key Performance Indicators (KPI) together with drill-down reports for branches and subsidiaries for the management level. The reports will be made available in PDF format.
Important requirements are: a) Possibility to make changes on the department level independently from IT, b) solution should be based on tools for which competence is abundant - Excel and PowerPoint. I was asked to develop an appropriate solution.
The system context
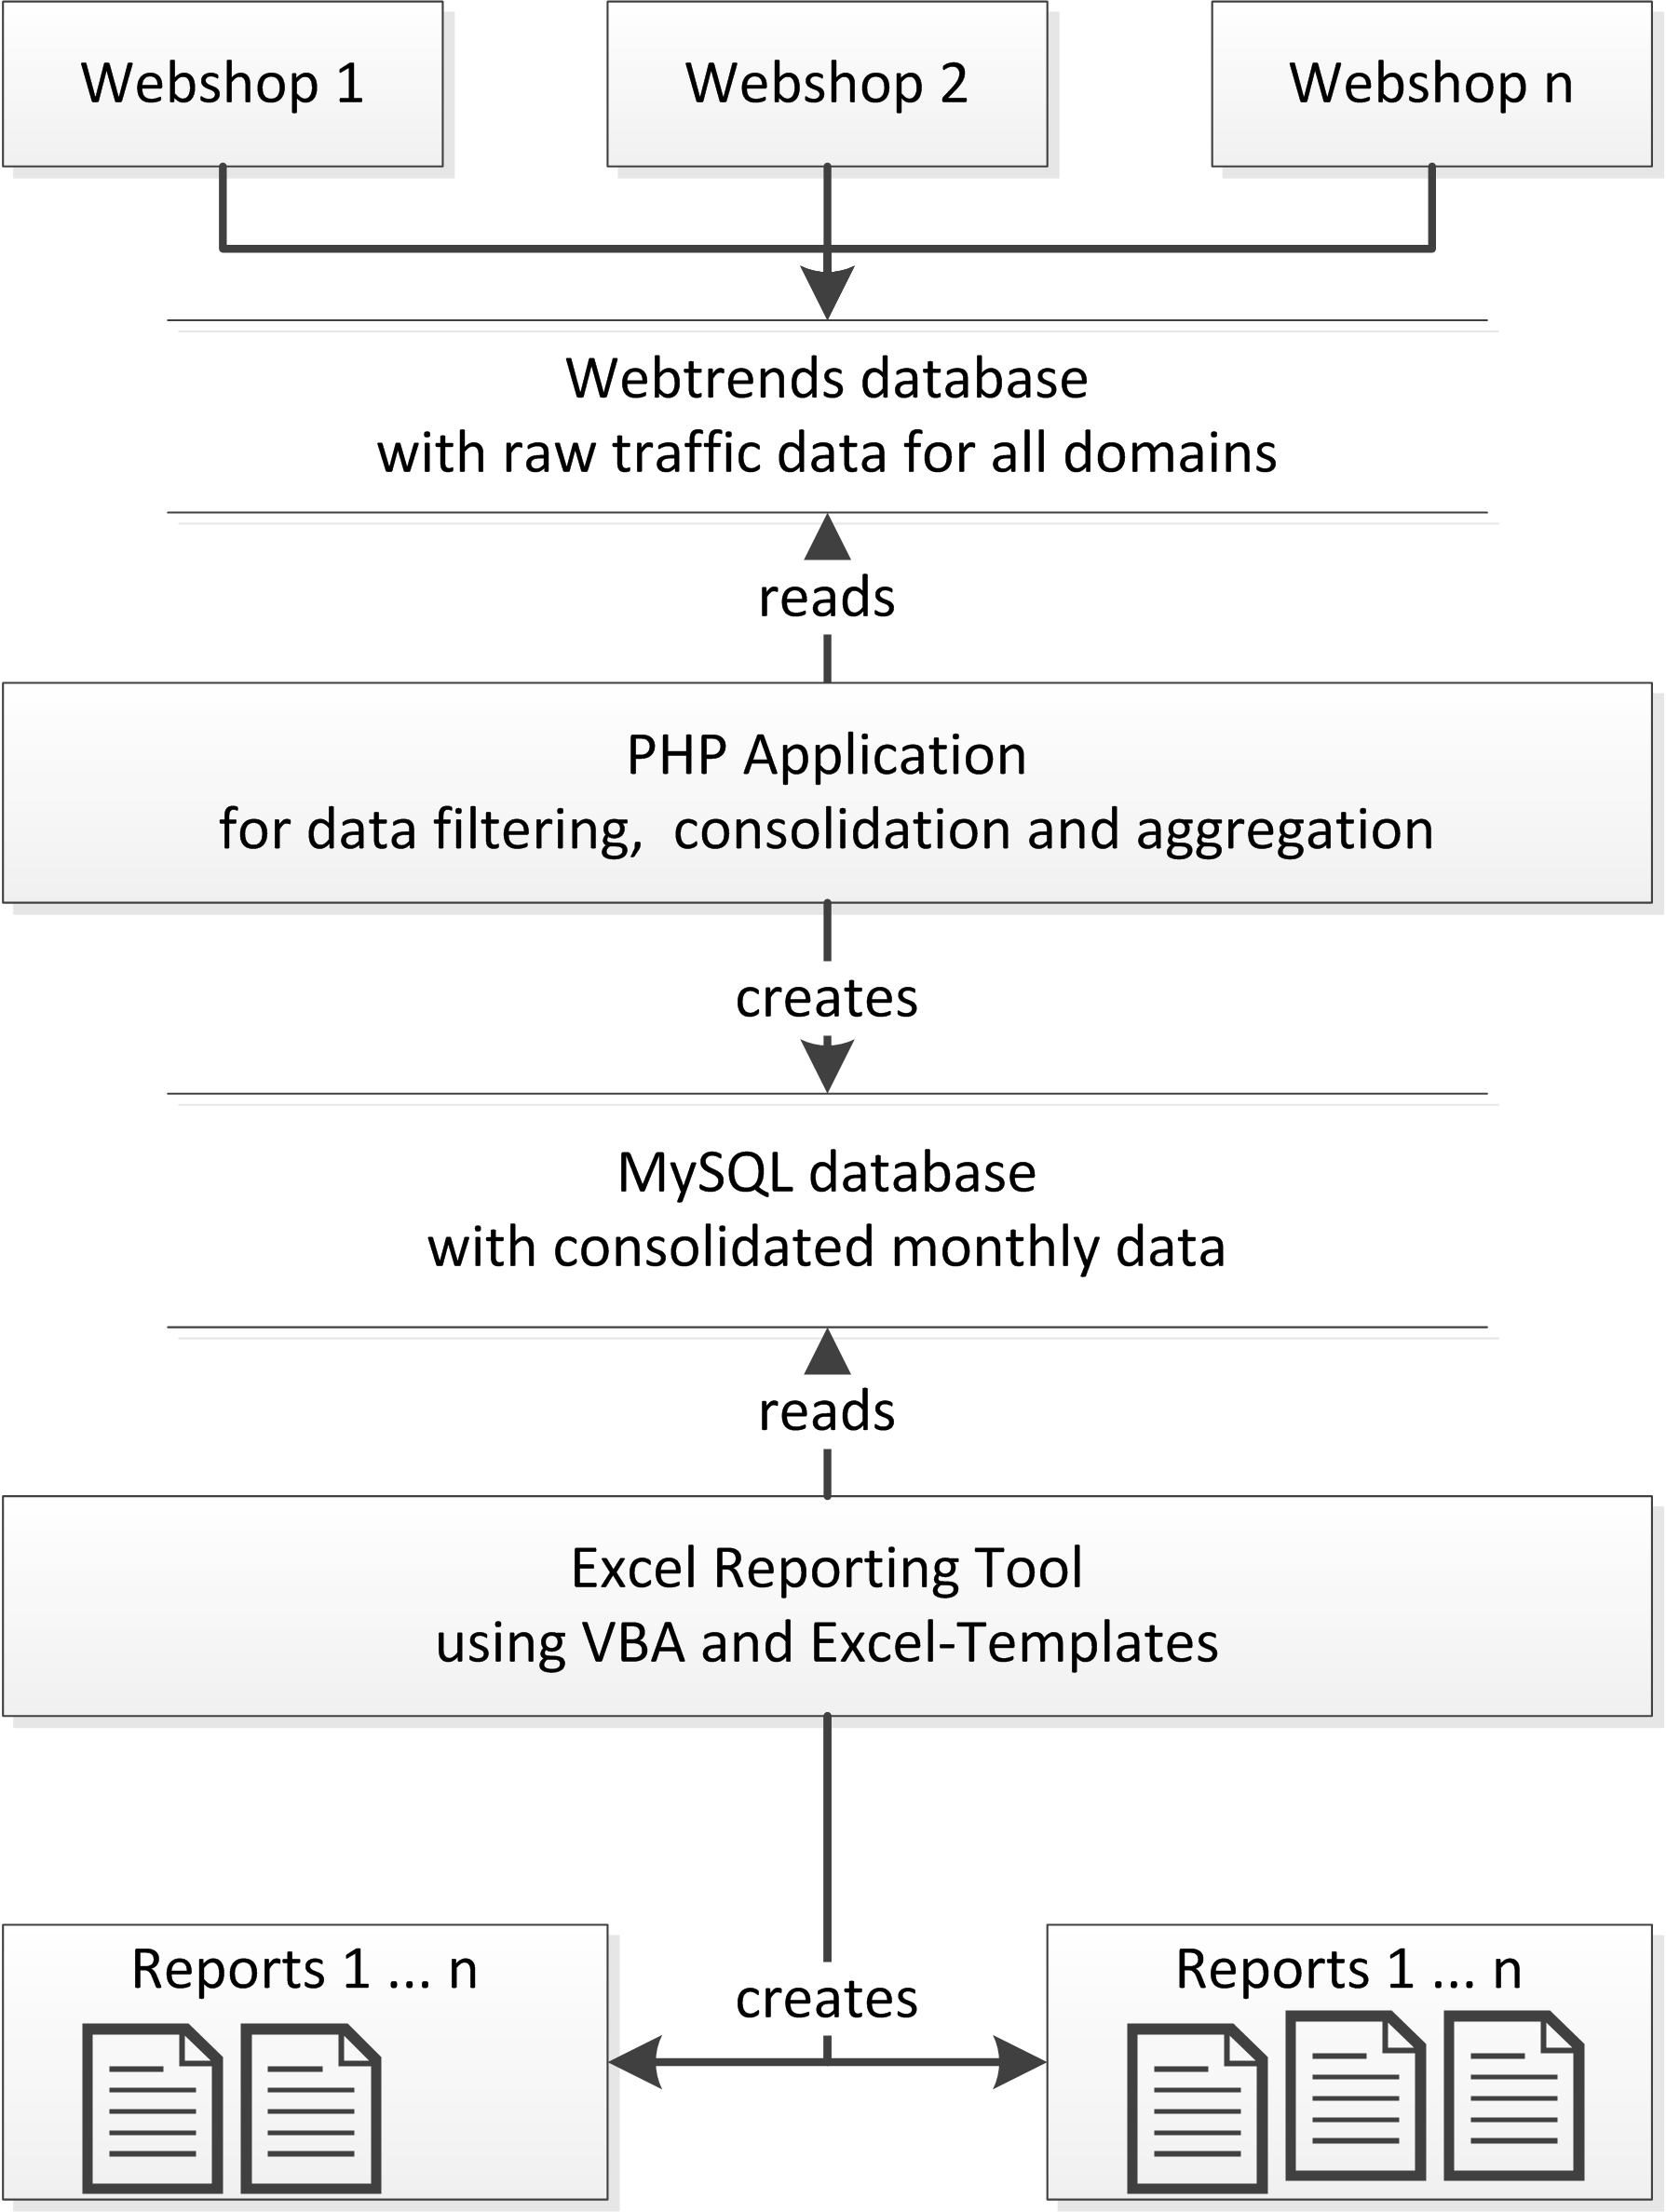
My part in the overall project (see drawing below) was limited to the development of an Excel-based solution to gather data from the MySQL database on to create the dashboards and reports from it. The other items belong to the wider system context and were not under my responsibility.
The solution
The templates / Separatation of data and presentation
For each dashboard and each report an Excel file was created which is used as a "template". In the template one or more sheets contain tables with parameters and SQL statements. One "presentation" sheets contains the layout for the report and formulas which refer to the data sheets:
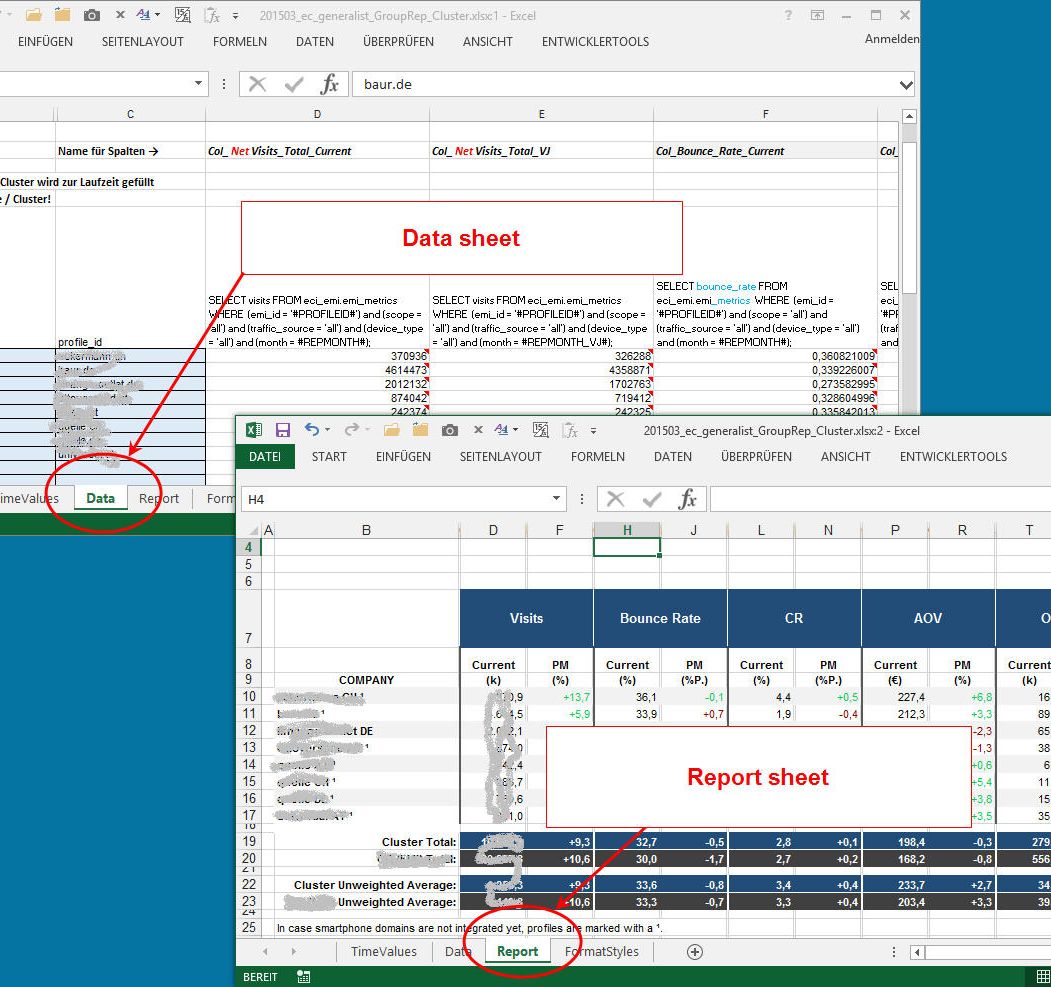
The SQL statements in the data sheets are tagged with keywords. During runtime, the statements are parsed and updated, so that the appropriate data are queried from the database.
This concept allows the use of all the excellent features of Excel 2013 for data analysis: classic charts, data bars, sparklines. Enhancements are possible with ad-hoc graphics which can be combined to cell-based images ("camera function"). The templates must follow some rules, but generally the templates can be authored without issues by the Excel power users in the department.
The reporting tool (VBA part)
The other part of the solution is the Reporting Tool, an Excel macro file (XLSM format). This file contains
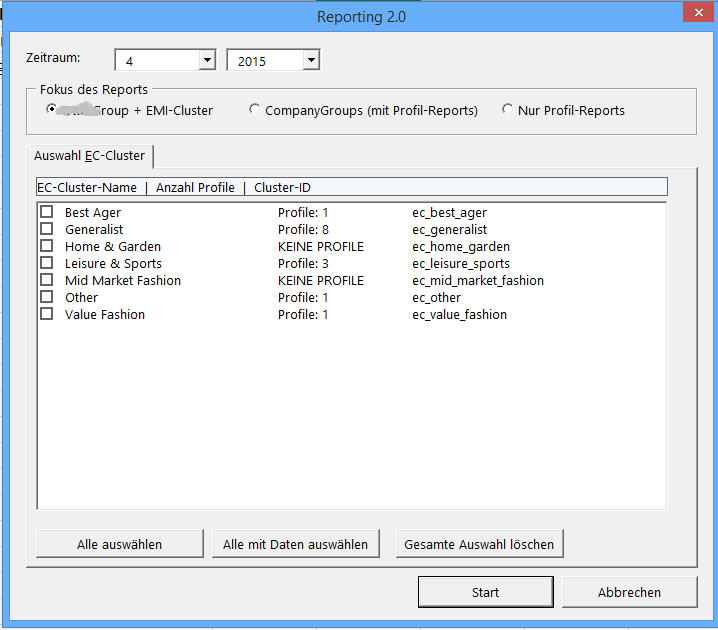
- a dialog in which the user can select important parameters for the reporting (time frame, subsidiaries, focus)
- all program logic
- to create the result files from the templates, and
- to interprete the base SQL statements and to update the destination cells with the current data from the MySQL database
- the usual help functions and procedures for logging, database connection, etc.